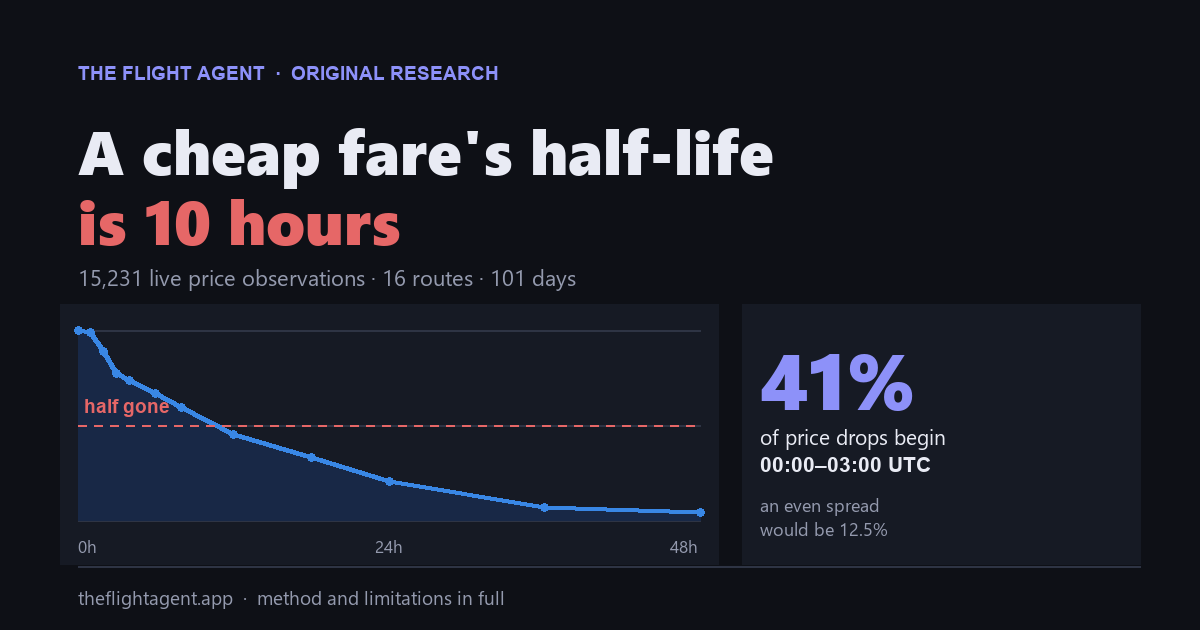
Every piece of advice about when to book a flight is built on daily snapshots. That is why it all sounds the same — book on a Tuesday, book eight weeks out, book in the afternoon. A daily snapshot can only ever tell you which day was cheap. It cannot tell you how long cheap lasted.
We check the same routes every couple of hours, so we can answer the question the daily studies cannot: once a fare drops to its cheapest, how long is it still there?
The answer is shorter than we expected, and it arrives at a strange hour.
Half of all cheap fares are gone within 10 hours
We took each route's own cheapest decile as its "cheap band" — the price you would be pleased to see on that route, judged against that route and nothing else. Then we measured every stretch where the live fare sat in that band, from the moment it dropped in to the observation that ended it.
There were 176 such windows across 16 routes. Half closed within 10 hours. 80% were gone inside a day.
You do not have a week to think about it. On the typical route you have about 13 hours, and on the fastest route in this sample you have 4.
The drops start just after midnight UTC
This was not what we went looking for. Sorting the windows by the hour they opened, they are not spread evenly across the day — they clump hard into the three hours after midnight UTC.
It is also not one odd route dragging the average. The effect shows up on 15 of the 16 routes we tracked, across four continents and sixteen different airline mixes.
We are measuring the effect, not the cause, so treat this as the likeliest explanation rather than a finding. Airline fares are filed and redistributed in batches on a daily cycle, and midnight UTC is a natural boundary for those jobs. A fare loaded overnight shows up in search results at the start of the UTC day — which, if you live in the Americas or East Asia, is not a time you are usually looking.
What a cheap window is actually worth
Catching one is worth about 10% — a median of $42 against that route's own median fare. And they are not rare: the typical route in this sample opened 4.5 of them per month, roughly one a week.
That combination is the whole problem with checking manually. Roughly weekly opportunities, each lasting around half a day, on a route you are not watching at 2am. The odds of your idle curiosity and the fare's cheap window landing in the same few hours are poor.
| Route | Observations | Days | Cheap band | Route median | Discount | Windows | Median length | Per month |
|---|---|---|---|---|---|---|---|---|
| HND-YYZ | 943 | 70 | $747 | $833 | 10.3% | 31 | 4.1h | 13.3 |
| MUC-IST | 1,143 | 91 | $75 | $83 | 10.3% | 16 | 7.8h | 5.3 |
| BLR-YYZ | 982 | 70 | $617 | $640 | 3.6% | 11 | 8.1h | 4.7 |
| OPO-CAI | 1,037 | 81 | $235 | $253 | 6.9% | 13 | 9.2h | 4.8 |
| MRS-DPS | 830 | 58 | $539 | $763 | 29.3% | 15 | 10.0h | 7.8 |
| DXB-ORD | 687 | 57 | $518 | $574 | 9.9% | 6 | 11.1h | 3.2 |
| MAD-SHA | 273 | 39 | $341 | $361 | 5.7% | 4 | 11.1h | 3.1 |
| VIE-NRT | 703 | 57 | $511 | $628 | 18.6% | 11 | 12.1h | 5.8 |
| TLV-NYC | 1,076 | 74 | $563 | $623 | 9.6% | 11 | 14.1h | 4.5 |
| YWG-LAS | 937 | 66 | $144 | $161 | 10.7% | 9 | 16.2h | 4.1 |
| YYZ-BEY | 1,083 | 76 | $594 | $634 | 6.3% | 9 | 17.6h | 3.6 |
| MAD-PEK | 1,108 | 79 | $323 | $371 | 12.7% | 8 | 19.2h | 3.0 |
| CDG-PVG | 1,519 | 60 | $440 | $459 | 4.3% | 9 | 20.2h | 4.5 |
| LUX-PVG | 1,074 | 75 | $464 | $531 | 12.6% | 12 | 23.2h | 4.8 |
| MRS-JED | 806 | 59 | $291 | $334 | 13.1% | 7 | 24.2h | 3.6 |
| ZRH-SAW | 1,030 | 70 | $67 | $80 | 15.8% | 4 | 30.9h | 1.7 |
The spread between routes is wide and worth respecting. ZRH-SAW held its cheap band for a median of 31 hours; HND-YYZ managed 4. If you are watching a busy, heavily-served route, assume you have less time than this study's average, not more.
How we did it, and what this cannot tell you
15,231 live price observations on 16 routes between 2026-06-06 and 2026-09-15, sampled a median of 2 hours apart, with 99% of consecutive readings less than six hours apart. Only routes with at least 30 days of coverage are included. Every comparison is within a single route, so the mix of cheap and expensive routes cannot distort any figure above.
These are not a random sample of the world's routes. They are routes our users asked us to watch. They skew long-haul and they skew towards places our users actually fly.
"Price" means the cheapest fare quoted on that route at that moment, not one particular seat. When the cheapest itinerary changes carrier or departure time between two readings, that shows up here as a price move.
20 windows were thrown away, not counted short. If a gap in our scanning meant we could not see when a window closed, it is excluded entirely rather than recorded at whatever length we happened to observe.
One season, 101 days. June to September 2026. We have no basis yet for saying whether the midnight pattern holds in January.
We deliberately did not answer "how many days ahead should I book". We tried. The same flight is observed on a median of one scan day in this dataset, so any lead-time curve would be built from different flights at different lead times — route mix dressed up as a trend. It is the single most requested number in this field and we would rather publish nothing than publish that.
Frequently asked questions
How long does a cheap flight price last? In this dataset, half of all cheap windows closed within 10 hours and 80% were gone within 24 hours. On the typical route the median window was 13 hours. About 34% closed within six hours.
What time of day do flight prices drop? 41% of the price drops we measured began between 00:00 and 03:00 UTC, against the 12.5% an even spread would produce. The pattern appeared on 15 of 16 routes. Fares are filed and redistributed on a daily batch cycle, and midnight UTC is a common boundary for those jobs.
Is it true that Tuesday is the cheapest day to book flights? Not in our data. We tested it directly in an earlier study of 13,799 fares and found Tuesday was the most expensive day to book, not the cheapest. The day-of-week effect is also far smaller than the swing within a single route.
How much do you save by catching a cheap window? The cheap band sat a median of 10% below the route's own median fare, about $42. The best route in this sample, MRS-DPS, had a gap of 29%.
How often do cheap fares appear? The typical route opened 4.5 cheap windows per 30 days — roughly one a week — though this varied from 1.7 to 13.3 across the routes we tracked.
Can I just check flight prices manually instead? You can, but the arithmetic is against you. A window of around half a day, opening roughly weekly, most often in the small hours of the UTC morning, means a daily check will miss most of them and a weekly check will miss nearly all.
Let something else sit up at 2am
The Flight Agent checks your route every hour and emails you when the fare drops. Two scouts are free, forever.
Watch a route free →
Comments